FORTNIGHT ISA MULTIMEDIA DOCUMENTARY PROJECT ON THE MILLENNIAL GENERATION: THE LAST GENERATION TO REMEMBER A TIME WITHOUT THE INTERNET. |
contributorsprofile
AGE OF EXPLORATION
AGE OF EXPLORATION
A CLOCKMAKER SPURRED DISCOVERY.
VICTORIA, CARTOGRAPHER, RECOUNTS THE QUEST
FOR MAP ACCURACY.
Read the essay now >>
A CLOCKMAKER SPURRED DISCOVERY.
VICTORIA, CARTOGRAPHER, RECOUNTS THE QUEST
FOR MAP ACCURACY.
Read the essay now >>

|
When you tell someone you’re a cartographer, ninety percent of the time you’ll get a single question in response: Hasn’t everything already been mapped? And the answer is, in a literal sense, yes. Every inch of the planet has been mapped. We’ve run out of continents to discover, and satellites can now pinpoint even the most remote island. Thar be no dragons anymore. But today’s cartographers are active as ever, mapping the changes—both physical and human—to the planet. We've run out of continents to discover, Since 1990, thirty-four new countries have been added to the atlas. This does not represent new territory, but rather new borders. Just this year, Sudan split into North Sudan and South Sudan as the latter declared formal independence.and satellites can pinpoint even the most remote island. The relevance of my vocation is not limited to political demarcation. With a map, one can display any sort of location-inclusive data: The changes in Census data from one year to the next. How a disease spreads outward from a single source.* Weather processes. Election results. Invasive species. Airline routes. |
How the delivery guy can get a pizza to your house in 30 minutes or less. That’s where we cartographers are now. But for any of this to be possible, we had to have an accurate base map. And accurate base maps haven’t been around for all that long! Though the oldest known world map dates back to Babylonian times, the greatest advances in cartographic accuracy came with the post-Medieval age of discovery.  Cartography in the so-called Dark Ages was not especially reliable. The prevailing worldview at the time was the T-O, or Orbis Terrarum, map. T-O maps, as the name supports, represent the earth as three sections divided by three waterways in a “T” formation, and surrounded by a ring of ocean. Jerusalem is located at the center of the world and the Nile, the Dardanelles (sometimes the Don) and Mediterranean Sea separate Europe, North Africa and Asia as the Northern Hemisphere (yes, they knew the earth was round! But the Southern Hemisphere was believed to be uninhabitable and thus, not worthy of inclusion). The post-Crusades boom in spice trade routes and acquisitive exploration next greatly expanded interest in classical cartographic methods (things |

1/4
|
like “a realistic interpretation of scale”). Demand rose for maps that were useful for not just illustrative, but also navigational purposes. Advances in seafaring technology encouraged explorers to go beyond known ground trade routes. Land navigation could be reliable if based on standard roads and known locations. Traveling by sea meant venturing into the unknown, without the visual reassurance of trusted markers along the way. Latitude was known at this point, of course, as sailors could judge how far north or south they were based star charts and the position of the sun above the horizon. The challenge instead lay with two factors: direction, and longitude. Gerardus Mercator is probably the most well-known cartographer in human history. His Mercator projection became the standard map not just for nautical navigation, but also for world maps. Up until very recently, a Mercator projection map was the go-to map of the world, able to be seen in classrooms and reference encyclopedias worldwide. Presented in 1569, Mercator’s map was the first to display true direction, un-deformed by the transformation process from a three-dimensional to two-dimensional surface. Rhumb lines, or loxodromes, are straight lines on a Mercator projection. A rhumb line intersects all meridians at the same angle. Great circles are lines that measure, essentially, the shortest distance |
between two points on the planet. Any two points have a great circle. Unless the points have the same latitude or longitude, the great circle route intersects the meridians at an angle. This gives straight lines constant bearing. Mercator’s map kept the North-South scale equal to the East-West scale, forcing lines of latitude and longitude into a conformal grid.** A ship’s navigator could use a protractor and compass to set a course by projection, without having to constantly adjust course. The remaining problem, of course, is how a navigator could then discern crossing a line of longitude. The measurement associated with a line of longitude, in degrees, is the location’s distance east or west of the Prime Meridian. Each line of longitude stretches from the North Pole to the South Pole. The Prime Meridian, 0 degrees, passes through the Royal Observatory in Greenwich, England. The problem in measuring accurate longitude is that, unlike latitude’s natural Equator baseline, the Prime Meridian is essentially an arbitrary distinction. The Earth is constantly rotating. A given point’s location east or west doesn’t mean anything if you don’t know where the Prime is relation to your position. The British government, seeking a solution, established the Board of Longitude in 1714 and offered a large sum of money to anyone who could develop and prove |
2/4
|
the accuracy of a method for determining longitude. The more accurate the method, the larger the purse. Enter John Harrison. A respected clockmaker, Harrison understood that a ship could calculate longitude if the crew could bring an extremely accurate clock aboard. By keeping a clock at Greenwich time and referencing the time at Greenwich when the Sun is highest in the sky—local noon—sailors could be reasonably sure of how far they were east (or west) of their home port. The prevailing theory at the time was that this was impossible; that clocks could not be made that precise, and that astronomical observations or star charts were instead the way to go. Clocks, at the time, required a pendulum to maintain their accuracy—but what good is a pendulum on turbulent seas? And at sea, the metal clock mechanism itself would expand and contract unexpectedly with changes in humidity and pressure. In 1730, Harrison presented a clock diagram to Sir Edmund Halley and George Graham, two respected members of British scientific society. Graham personally funded Harrison’s efforts to build the diagrammed clock, called H-1, which was presented to the Board five years later. It proved accurate on an intra-continental voyage within |
sixty miles, for which the Board of Longitude granted Harrison funds to produce further devices. It was his third clock, the H3, that included the two most important components. The H3’s captured roller bearing keeps the timepiece balanced on rough waters, while the bimetallic strip—a combination of a metal that contracts with a metal that expands when heated—kept the clock parts from warping under temperature stress. Sea voyages were no longer based on guesswork, dead reckoning or luck. Though the Board of Longitude was reluctant to award the full prize to Harrison, his eighteenth century advances in maritime technology—in conjunction with Mercator’s already two-hundred-year-old cartography—meant that sea voyages were no longer based on guesswork, dead reckoning or luck. So sailors were able to wreck less. How does that translate to an accurate base map today? Long, exploratory ocean voyages often included a vigorous survey of the new land, claimed for that nation sponsoring the journey. Scientific surveying techniques became increasingly precise as countries expanded to multicontinental empires. |
3/4
|
Many such empires then adopted national cartographic standards. They formed agencies dedicated to mapping and understanding the extent of their territorial empires. The resultant base maps make possible the sophisticated exercises that today's cartographers enjoy—from disaster mapping, to educational information design. And, yes—accurate maps also help us trace the real-time trajectory of incoming pizza while we labor over models at our desks.  *** Victoria Johnson is a GIS (geographic information science) analyst and cartographer based in Washington, DC. She graduated from the Department of Geography at George Washington University. |
4/4

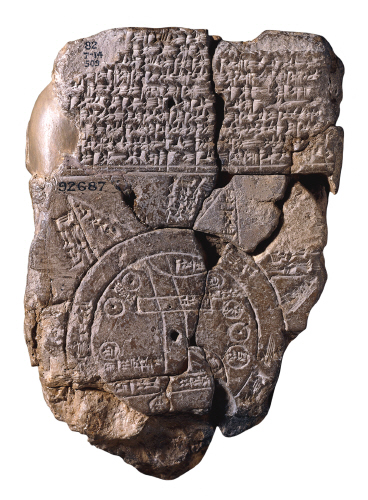
Babylonian Map of the World, c. 600 BC.
Currently housed at the British Museum.
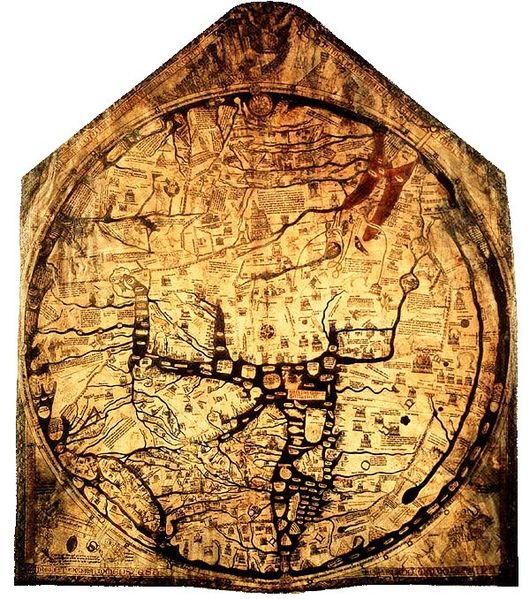
The Hereford Mappa Mundi, 1300, housed at the Hereford Cathedral, England. It is a classic T and O map with Jerusalem at center, east toward the top, Europe at bottom left and Africa on the right.
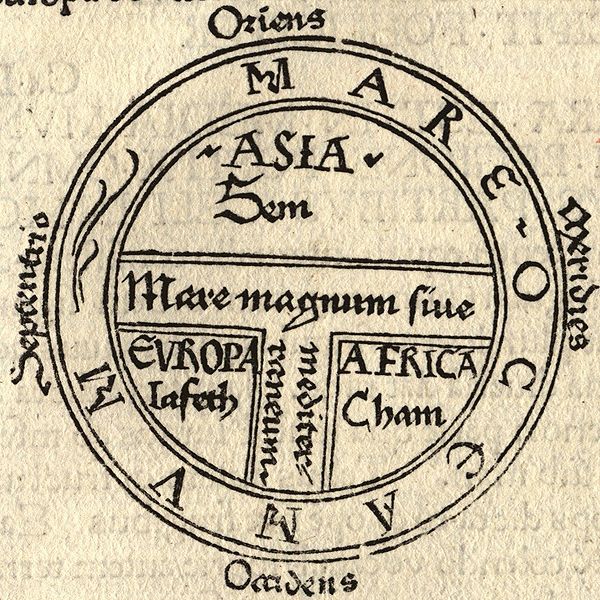
Earliest printed example of a classical T and O map by Günther Zainer made in Augsburg in 1472. The map represents the continents as domains of the sons of Noah: Sem (Shem), Iafeth (Japheth) and Cham (Ham).


